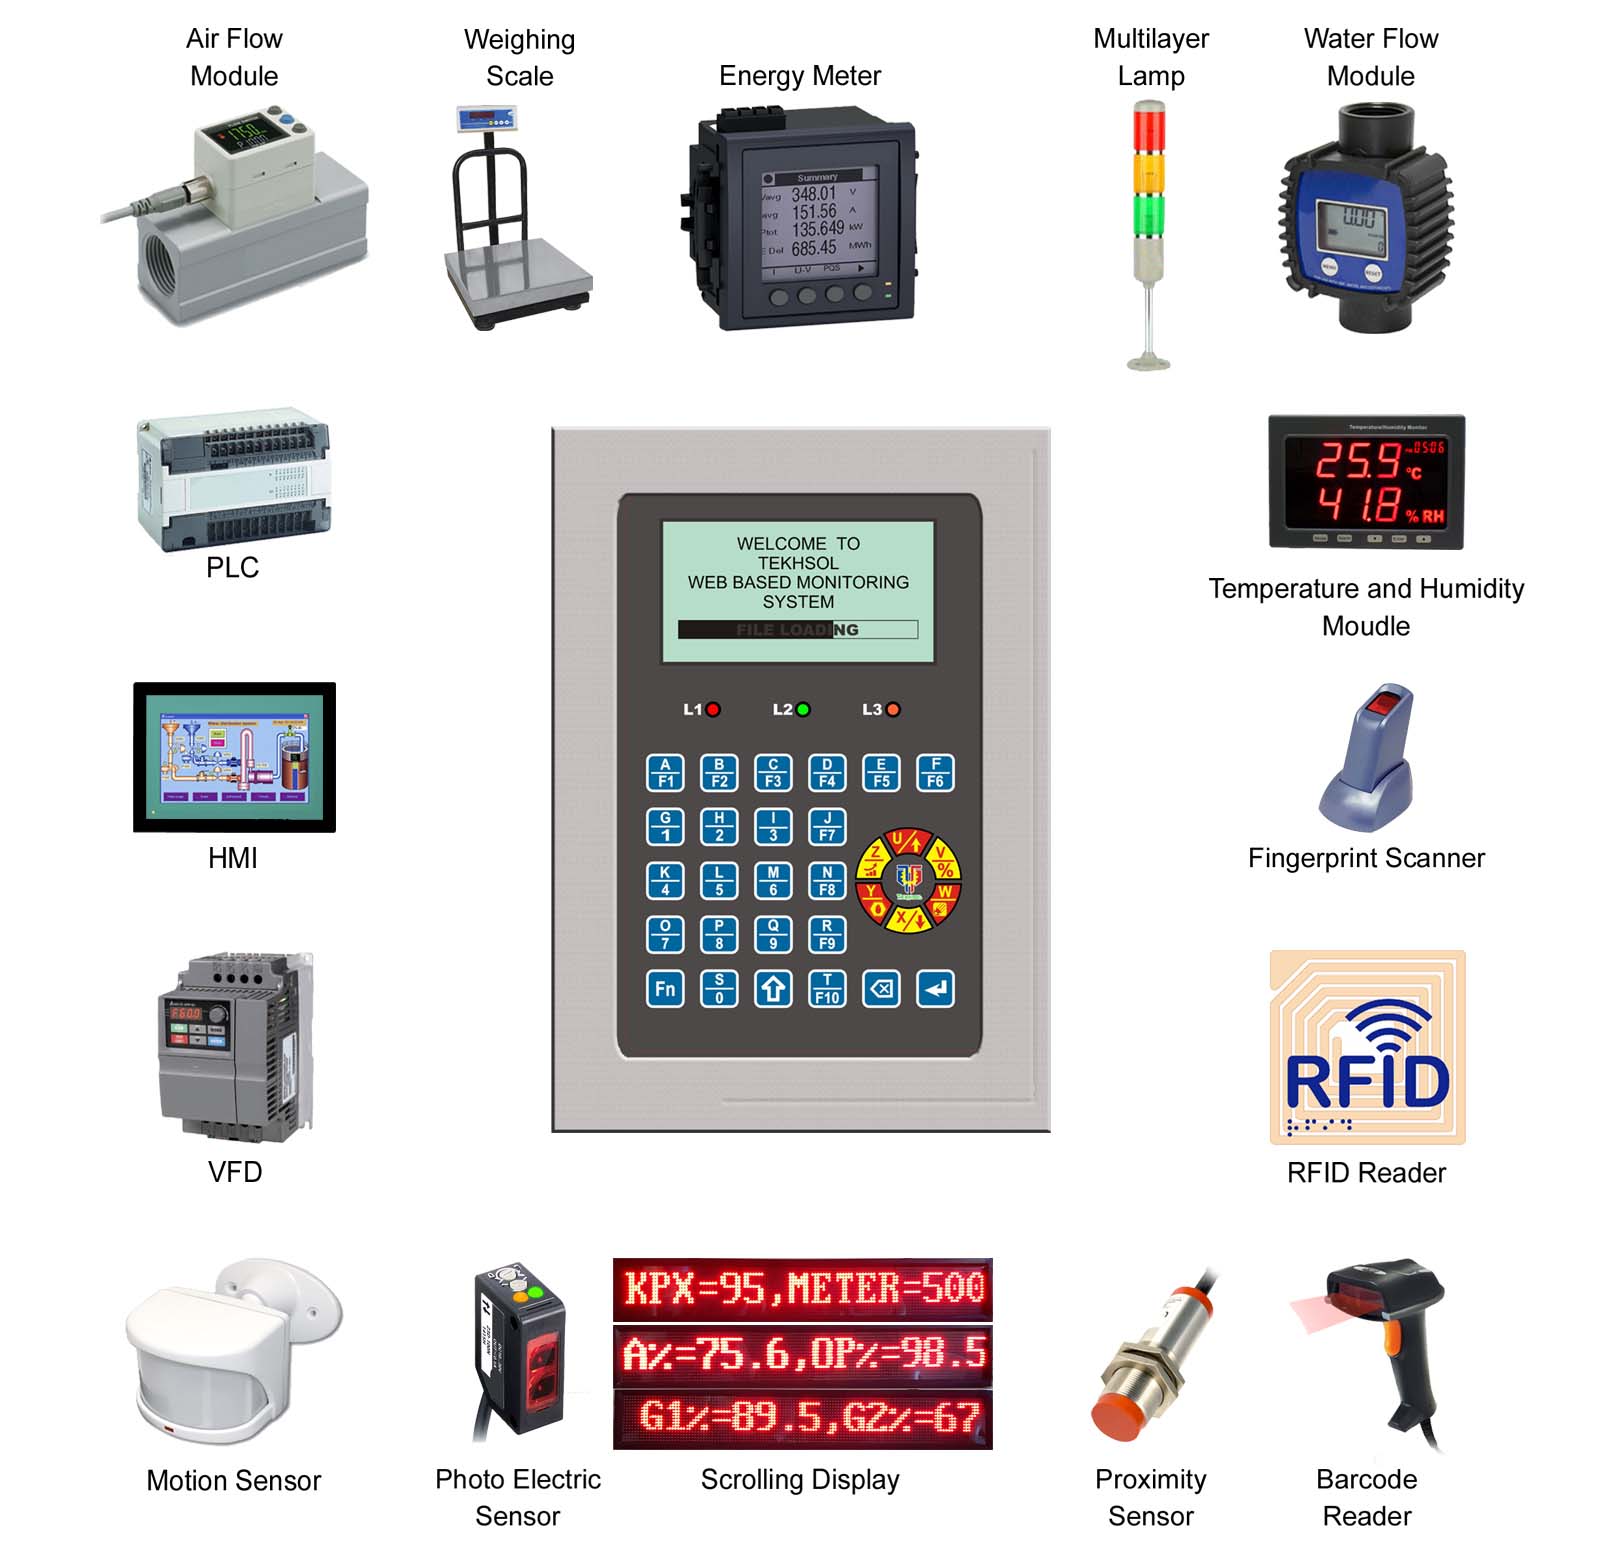
Web Based Monitoring System is the measuring and recording of physical or electrical parameters over a period of time. Some applications require only a single measurement, while others may require multiple channels and multiple types of measurements. Web Based Monitoring System is available with various channel configurations: single-channel devices, multichannel devices, and modular devices with a mixture of measurement types. It can measure different types of signals and sensors including the following Production(Total Process Time, Individual Process Time, Target Achieved), Stoppage(Rejected), Line Voltage, Phase Voltage, Current, Kilo Watts, Frequency, Power Factor, KWH, Humidity and Temperature
This presents the following advantages over traditional stand-alone Web Based Monitoring System
| Production Details | |
|---|---|
| Integrated All information about Machines at one Server | |
| Clarify Weak Areas | Machine Running Time |
| Actual Efficiency | Production Efficiency |
| Installed Efficiency | Utilization Efficiency |
| Total Process Time | Individual Process Time |
| Production(Target, Achieved) | Various Stop Time |
| Stop Code Details | Operator Details |
| Technician Details | Supervisor Details |
| Operator Group Details | Technician Group Details |
| Supervisor Group Details | |
| Hour Wise Production and Stop Report with Analysis | |
| Instant alerts for Order Status, Stoppages,etc.. | |
| Automatic and Manual Employee Planning and Allocation | Employee Analysis |
| Dashboard For Immediate Response | Various Types Of Charts Like Line, Bar and Pie |
| Monitoring Screen For Production, Stoppage and Operator Details | |
| Hour / Shift / Day wise /From To Production and Stoppage Reports | |
| Monthwise Report For Production and Stoppage | |
| Comparision Report For Any TWO Parameters | |
| Units/Production | |
| Usage Of Bar Code | ||
|---|---|---|
| Operator Details | Technician Details | Supervisor Details |
| Operator Group Details | Technician Group Details | Supervisor Group Details |
| Energy Details | |
|---|---|
| Line Voltage(R Phase,Y Phase, B Phase) | |
| Phase Voltage (RY Phase,YB Phase,BR Phase) | |
| Current (R Phase,Y Phase, B Phase,Total) | |
| Power Factor(R Phase,Y Phase, B Phase, Average - Instantaneous) | |
| Watts (R Phase,Y Phase, B Phase ,Total) | |
| Frequency | |
| VAR (R Phase,Y Phase, B Phase ,Total) | |
| VA (R Phase,Y Phase, B Phase ,Total) | |
| KWH | |
| Humidity | ||
|---|---|---|
| Minimum Humidity Value(Rh) | Maximum Humidity Value(Rh) | Live Humidity Value(Rh) |
| Temperature | ||
|---|---|---|
| Minimum Temperature Value(Celsius) | Maximum Temperature Value(Celsius) | Live Temperature Value(Celsius) |
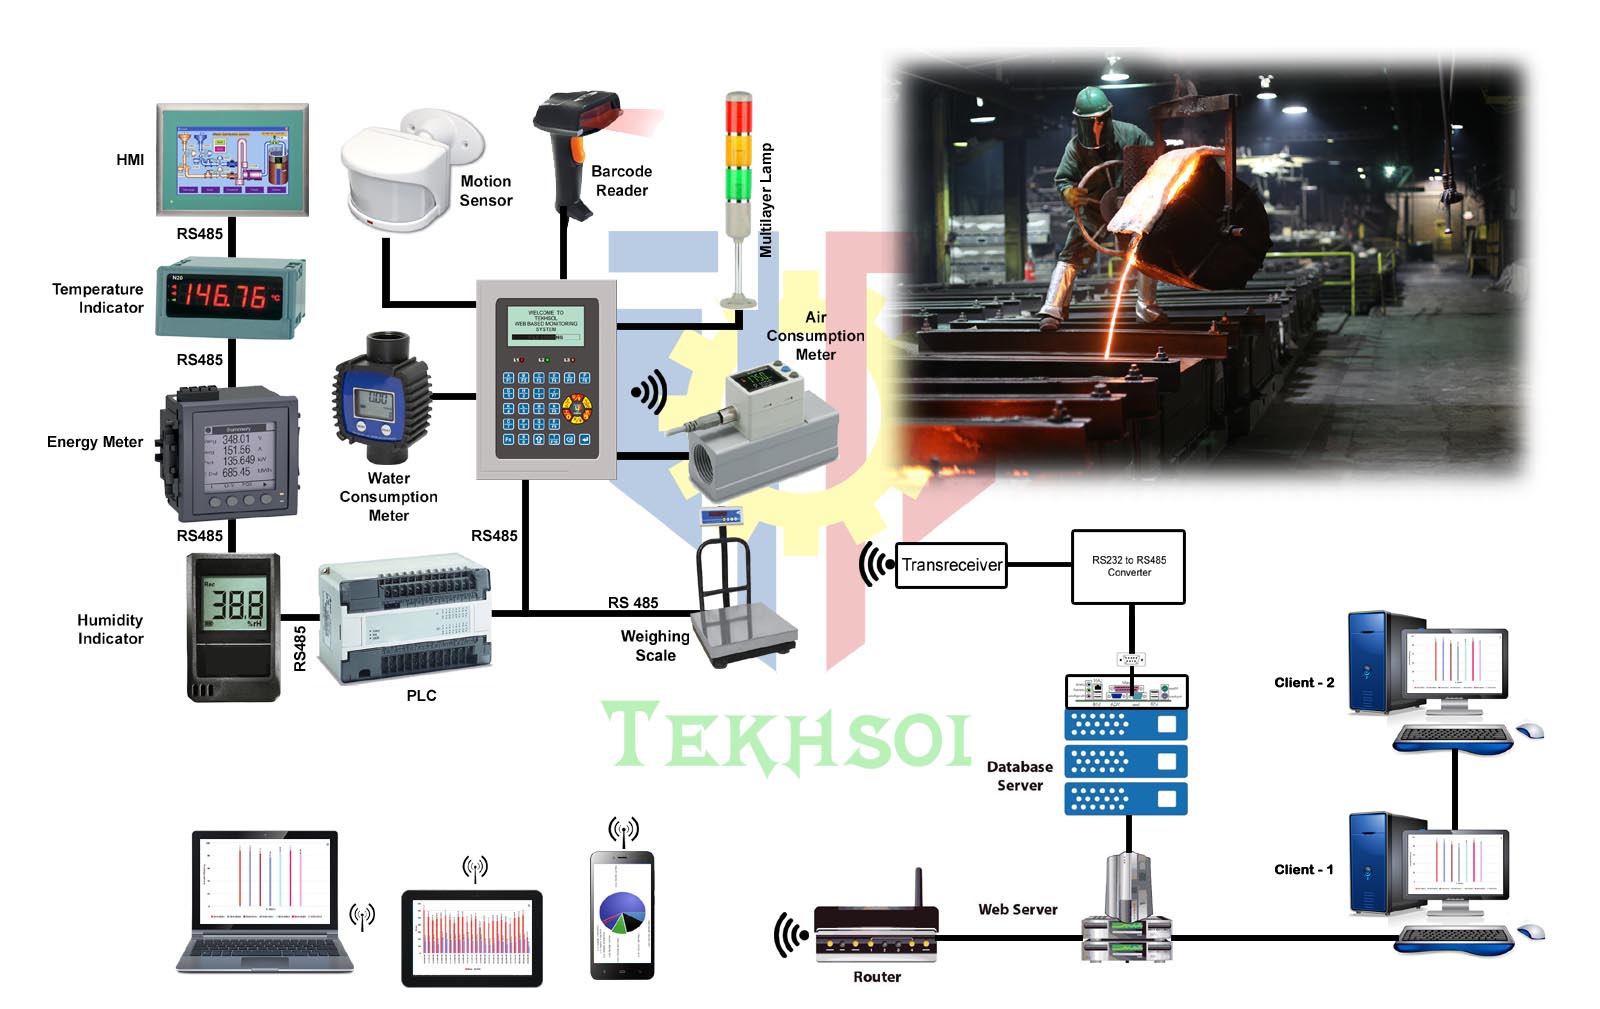
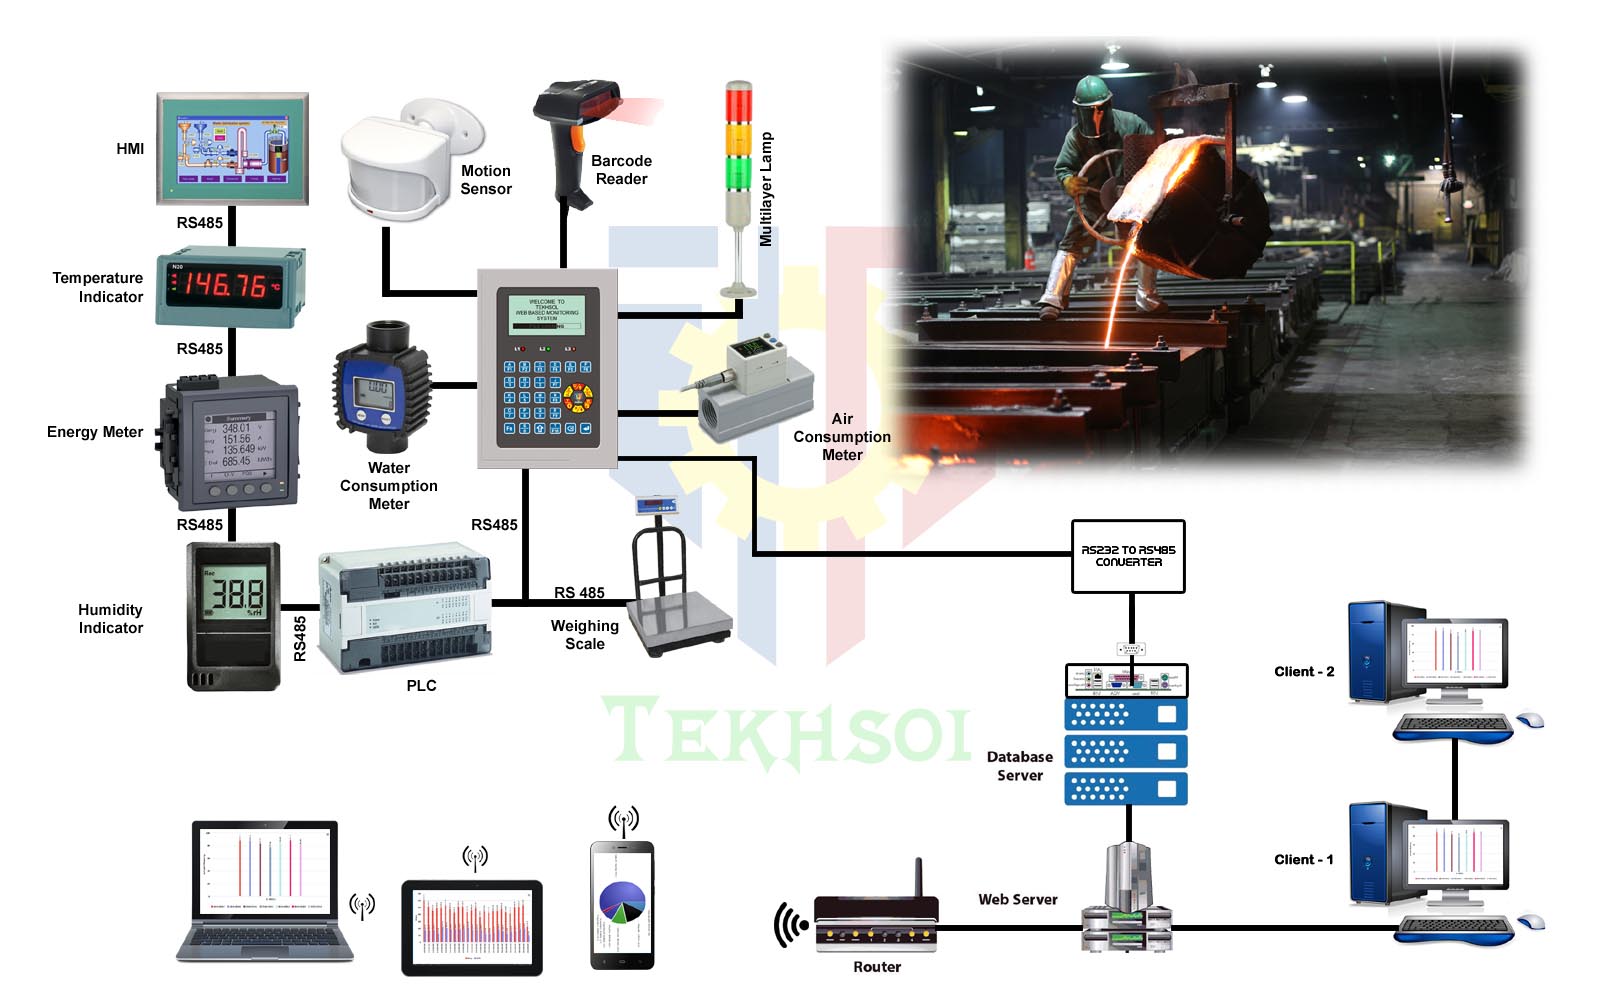
Real-Time Visualization
With a traditional stand-alone data logger, you must first record the data and then manually transfer it to a PC before you can import it into a spreadsheet program or other tool to graph and visualize the data.
Because a PC-based data logger is always connected to the PC, live measurements are displayed on the PC monitor in real time and you can see results instantly. You can use programming environments, such as Web Based Software, to build custom user interfaces for controlling your measurement device and displaying the results. Creating a user interface with Web Based Software is as simple as dragging and dropping controls and graphs on the user interface.
Inline Analysis
Data analysis with a traditional stand-alone data logger is typically performed offline only after the data has been transferred to the PC.
Using a PC-based data logger, you can take advantage of multicore processors and increasingly available RAM in the PC to perform signal processing and analysis on your data as you acquire it. Web Based Software includes many common math and signal processing functions that use configuration wizards and make it easy to add analysis to your measurements.
User-Defined Functionality
With a traditional stand-alone data logger, you are generally limited to hardware and software functionality defined by the vendor. These functions are good for accomplishing general-purpose tasks, but they may not help you meet your unique application requirements. For example, you may want to log data only under certain conditions or generate custom alarms that aren't built into the data logger.
PC-based data loggers are software-defined instruments. This means the functionality of the device is defined by the software, and you can customize the software to meet your specific application needs. Using Web Based Software, you can easily build functionality for custom alarms, logging conditions, report generation, and signal analysis. You can log data to virtually any file format for importing into other tools and sharing data with others.
Terabytes of Data Storage
Data storage is an important component of a data logger. You can log only as much data as you can store in your data logger. Traditional stand-alone data loggers are limited by the amount of memory built into the device.
Because the PC is actually a part of a PC-based data logger, you are limited only by the amount of hard drive space on the PC. Today, it's not uncommon to find a PC hard drive with terabyte capacity that provides ample space for your current measurements as well as permanent storage space.
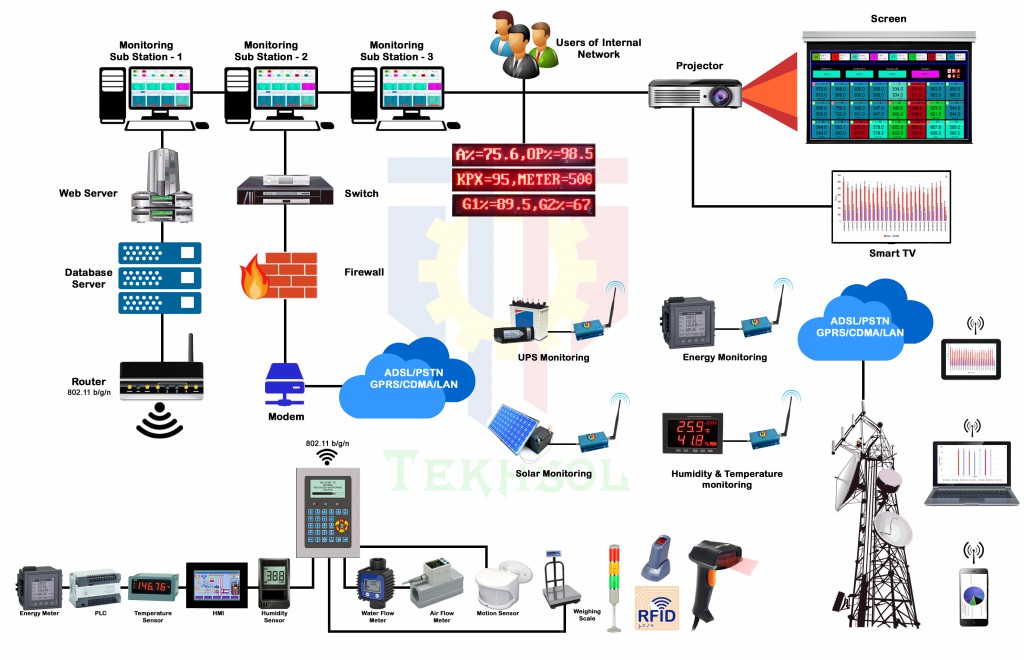
Network Connectivity
For applications that require long-term monitoring over days or weeks, you may have difficulty continually checking results. Remote monitoring is useful because you can see results from a remote location. Using a PC-based data logger, you can take advantage of the PC's network connectivity to transmit results over a network for remote viewing. With Web Based Software, you can create custom alarm conditions that send e-mails or even design a Web service that you can visualize over a Web-based application.